-- Attaching packages --------------------------------------- tidyverse 1.3.2 --
v tibble  3.1.8      v dplyr   1.0.10
v tidyr   1.2.1      v stringr 1.4.1
v readr   2.1.3      v forcats 0.5.2
v purrr   0.3.5
-- Conflicts ------------------------------------------ tidyverse_conflicts() --
x dplyr::filter() masks stats::filter()
x dplyr::lag()    masks stats::lag()
library(Ecdat)
Loading required package: Ecfun

Attaching package: 'Ecfun'

The following object is masked from 'package:base':

    sign


Attaching package: 'Ecdat'

The following object is masked from 'package:datasets':

    Orange
       District             Sex             Age             Edu           Arear
     0.00000000      0.00000000      0.00000000      0.00000000      0.00000000
         Career         Career8          Ethnic           Party         PartyID
     0.00000000      0.00000000      0.00000000      0.00000000      0.00000000
          Tondu          Tondu3             nI2        votetsai           green
     0.00000000      0.00000000      0.00000000      0.25384615      0.00000000
    votetsai_nm    votetsai_all    Independence     Unification              sq
     0.25384615      0.14674556      0.00000000      0.00000000      0.00000000
      Taiwanese             edu          female     whitecollar       lowincome
     0.00000000      0.00591716      0.00000000      0.00000000      0.00000000
         income       income_nm             age             KMT             DPP
     0.00000000      0.19526627      0.00000000      0.00000000      0.00000000
            npp         noparty             pfp           South           north
     0.00000000      0.00000000      0.00000000      0.00000000      0.00000000
  Minnan_father Mainland_father      Econ_worse      Inequality     inequality5
     0.00000000      0.00000000      0.00000000      0.00000000      0.00000000
     econworse5 Govt_for_public        pubwelf5  Govt_dont_care      highincome
     0.00000000      0.00000000      0.00000000      0.00000000      0.19526627
        votekmt      votekmt_nm            Blue           Green        No_Party
     0.00000000      0.25384615      0.00000000      0.00000000      0.00000000
       voteblue     voteblue_nm       votedpp_1       votekmt_1
     0.00000000      0.25384615      0.11065089      0.11065089
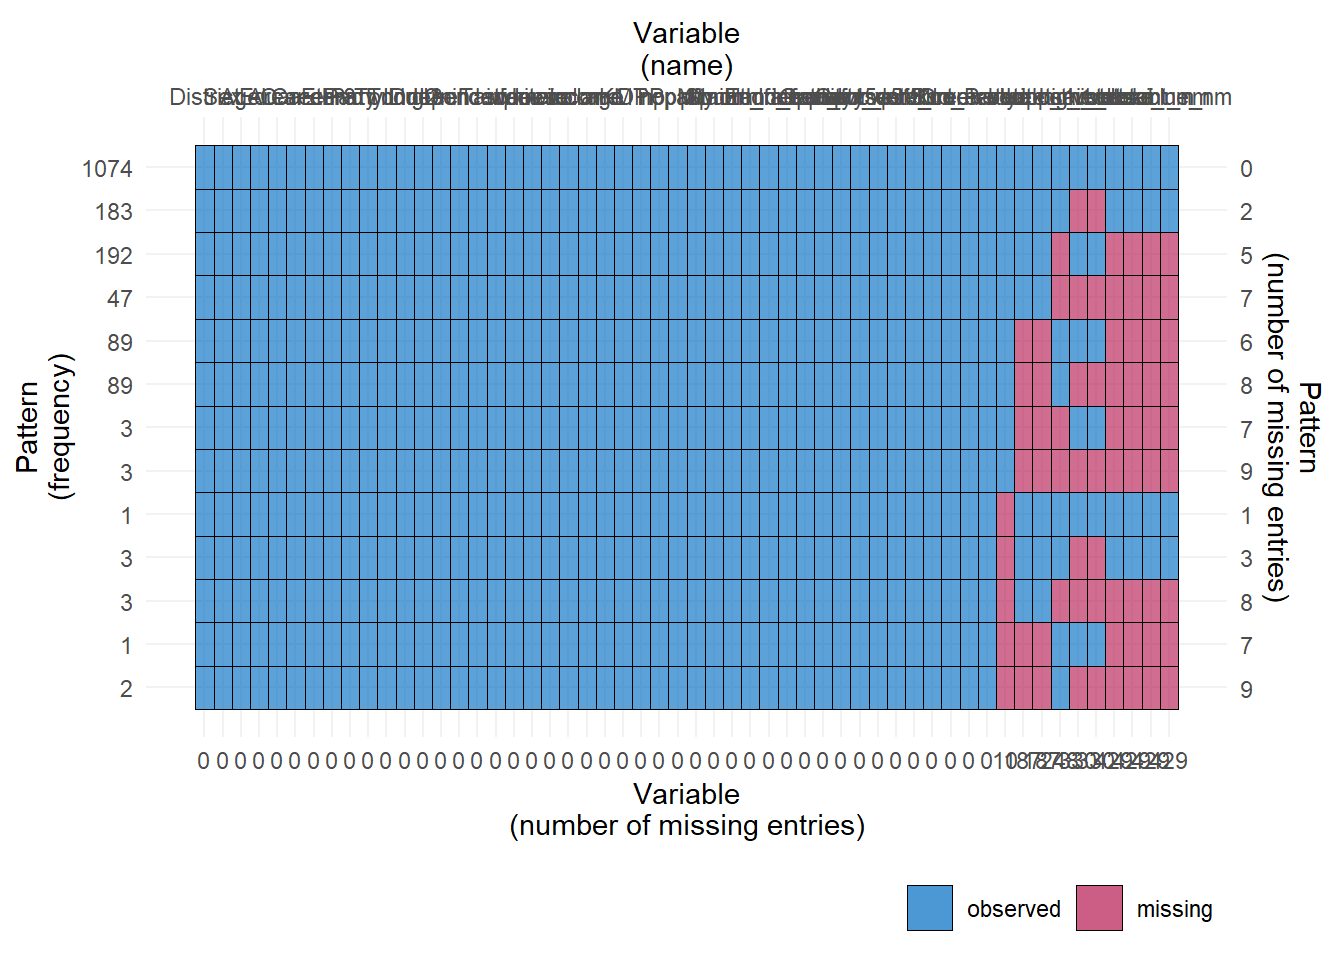
plot_pattern(TEDS_2016)
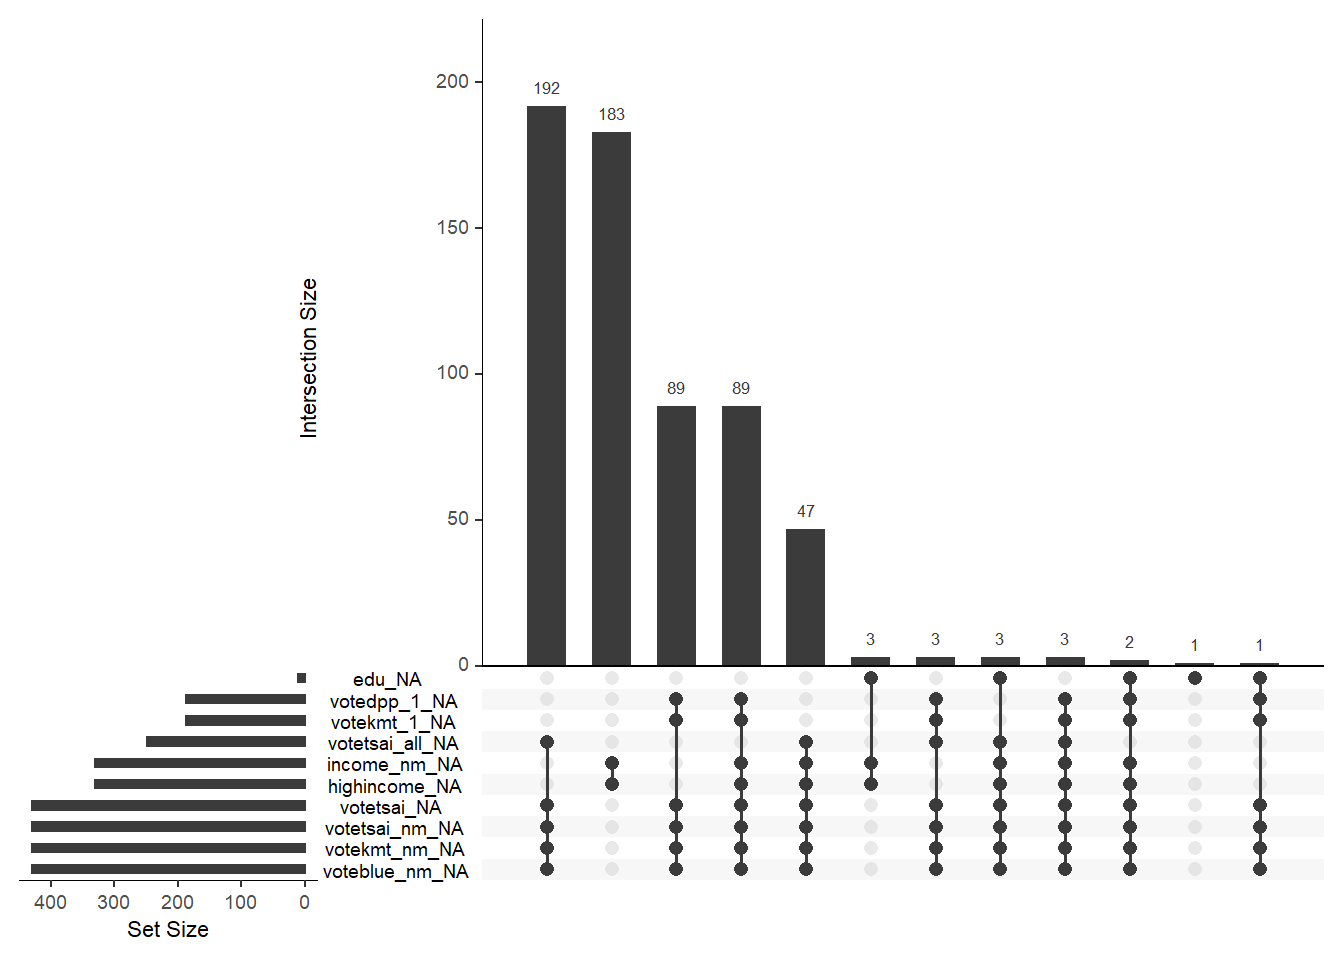
TEDS_2016 %>%# Create an UpSet plotgg_miss_upset(., nsets =10)
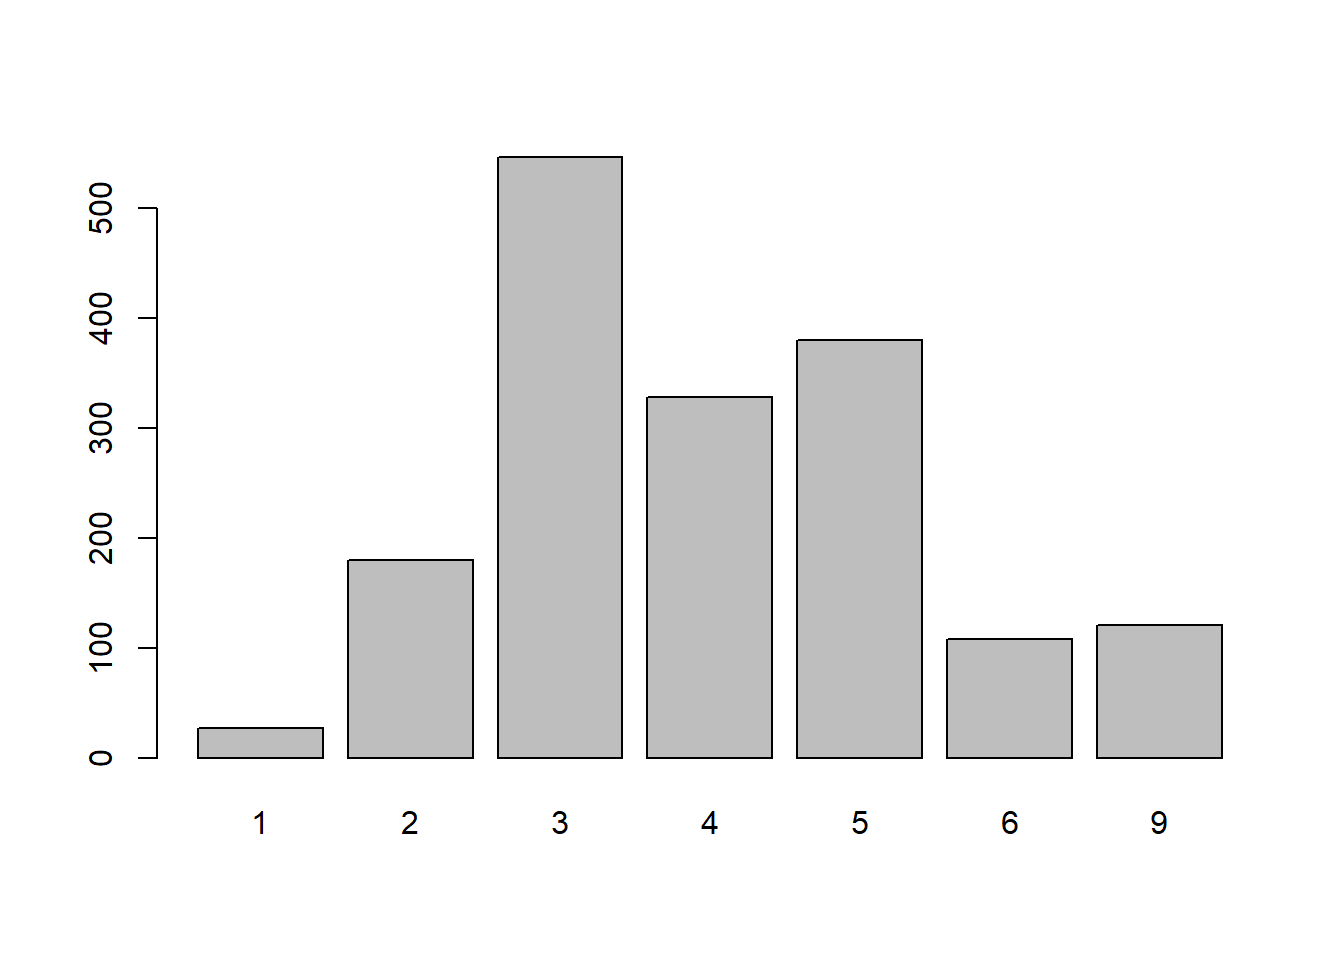
table(TEDS_2016$Tondu)
  1   2   3   4   5   6   9
 27 180 546 328 380 108 121
Some plots
barplot(table(TEDS_2016$Tondu))
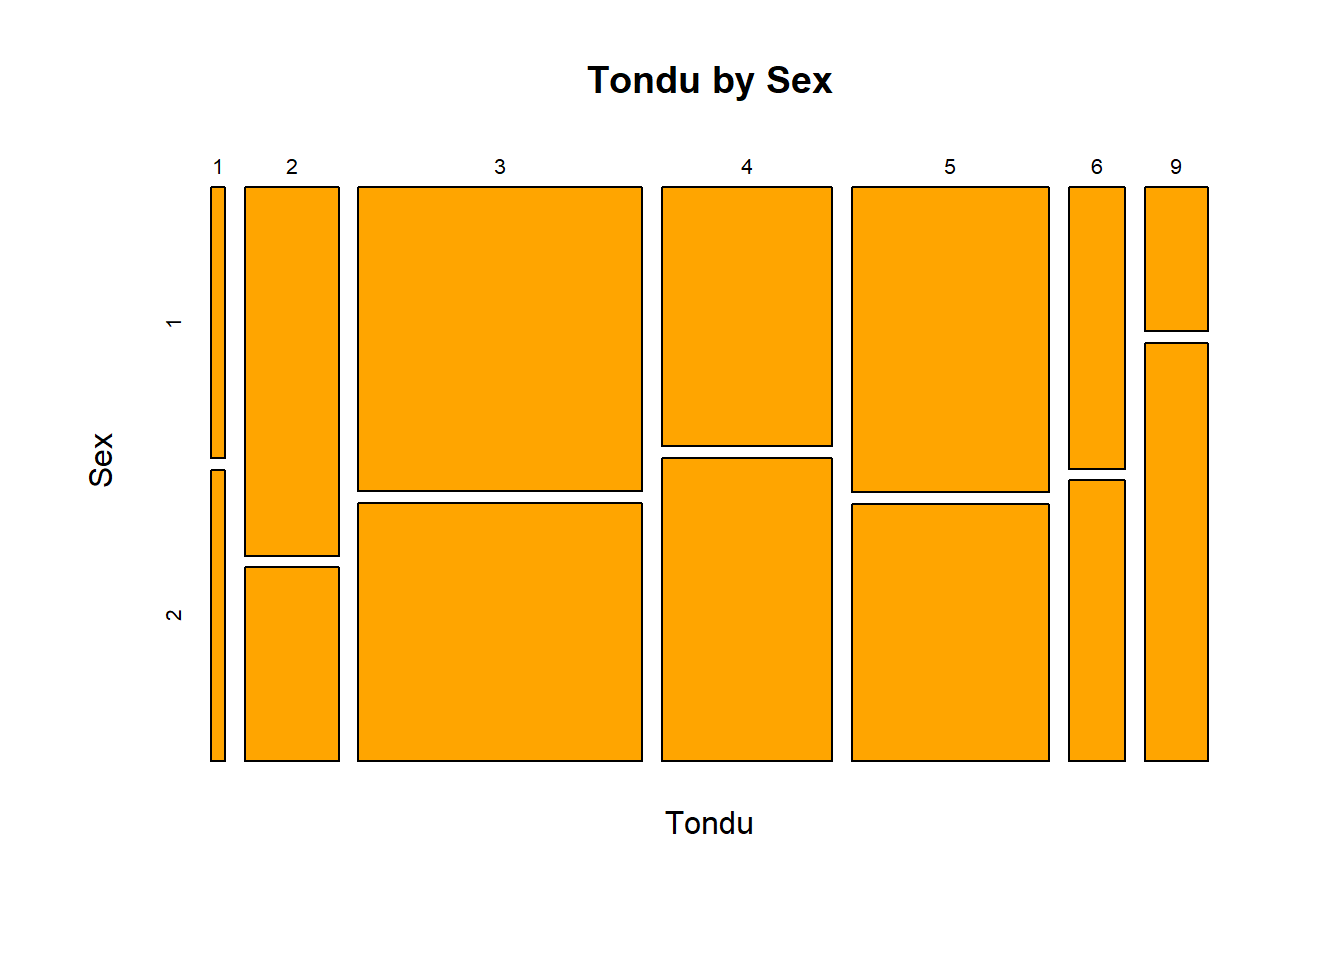
counts <-table(TEDS_2016$Tondu, TEDS_2016$Sex)mosaicplot(counts, xlab='Tondu', ylab='Sex',main='Tondu by Sex', col='orange')
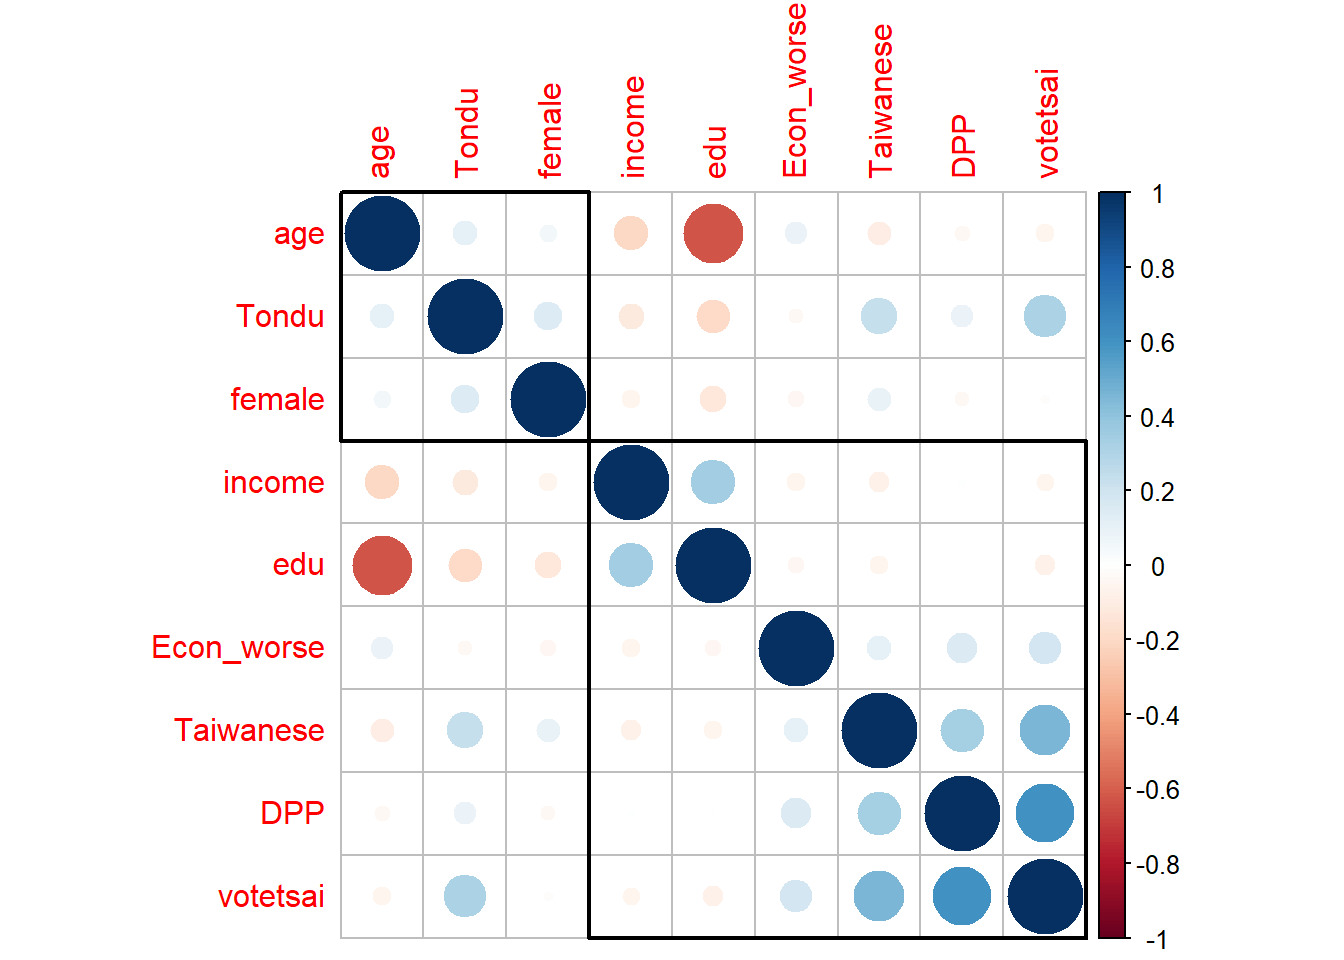
Correlation plots
sel_dat<-TEDS_2016%>%select(Tondu,female, DPP, age, income, edu, Taiwanese, Econ_worse,votetsai)cormat <- sel_dat %>%cor(., use ="pairwise.complete.obs")corrplot(cormat, # correlation matrixorder ="hclust", # hierarchical clustering of correlationsaddrect =2) # number of rectangles to draw around clusters
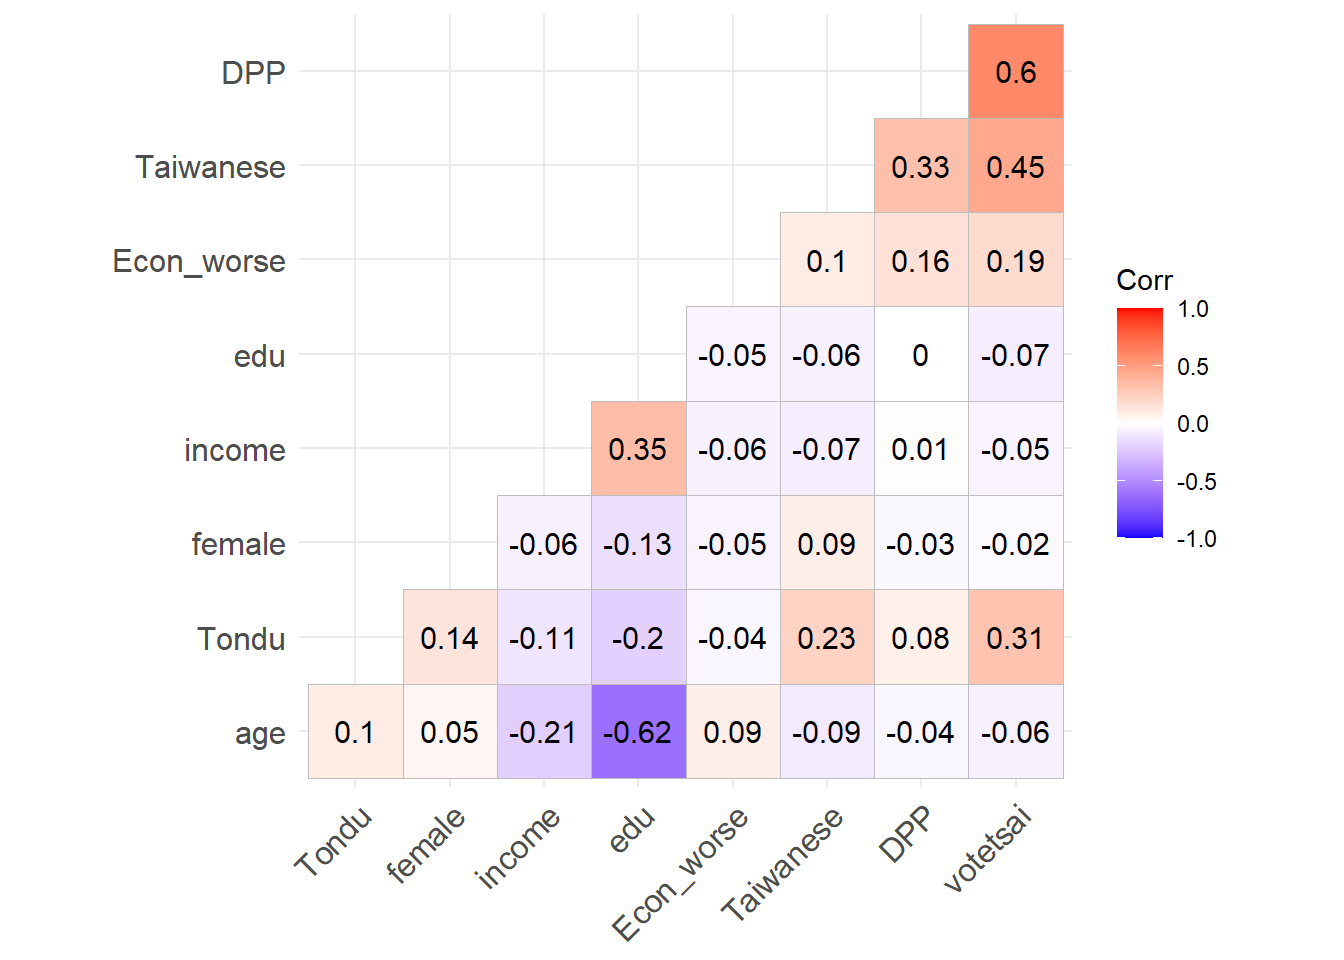
ggcorrplot(cormat, # correlation matrixtype ="lower", # print the lower part of the correlation matrixhc.order =TRUE, # hierarchical clustering of correlationslab =TRUE) # add correlation values as labels