Call:
lm(formula = Tondu ~ age + edu + income, data = sel_dat)

Residuals:
    Min      1Q  Median      3Q     Max
-3.7780 -1.1841 -0.4322  1.1079  5.4157

Coefficients:
             Estimate Std. Error t value Pr(>|t|)
(Intercept)  5.302529   0.257369  20.603  < 2e-16 ***
age         -0.004205   0.003194  -1.316   0.1882
edu         -0.244608   0.037579  -6.509 9.96e-11 ***
income      -0.031855   0.016357  -1.948   0.0516 .
---
Signif. codes:  0 '***' 0.001 '**' 0.01 '*' 0.05 '.' 0.1 ' ' 1

Residual standard error: 1.725 on 1676 degrees of freedom
  (10 observations deleted due to missingness)
Multiple R-squared:  0.04287,   Adjusted R-squared:  0.04115
F-statistic: 25.02 on 3 and 1676 DF,  p-value: 7.771e-16
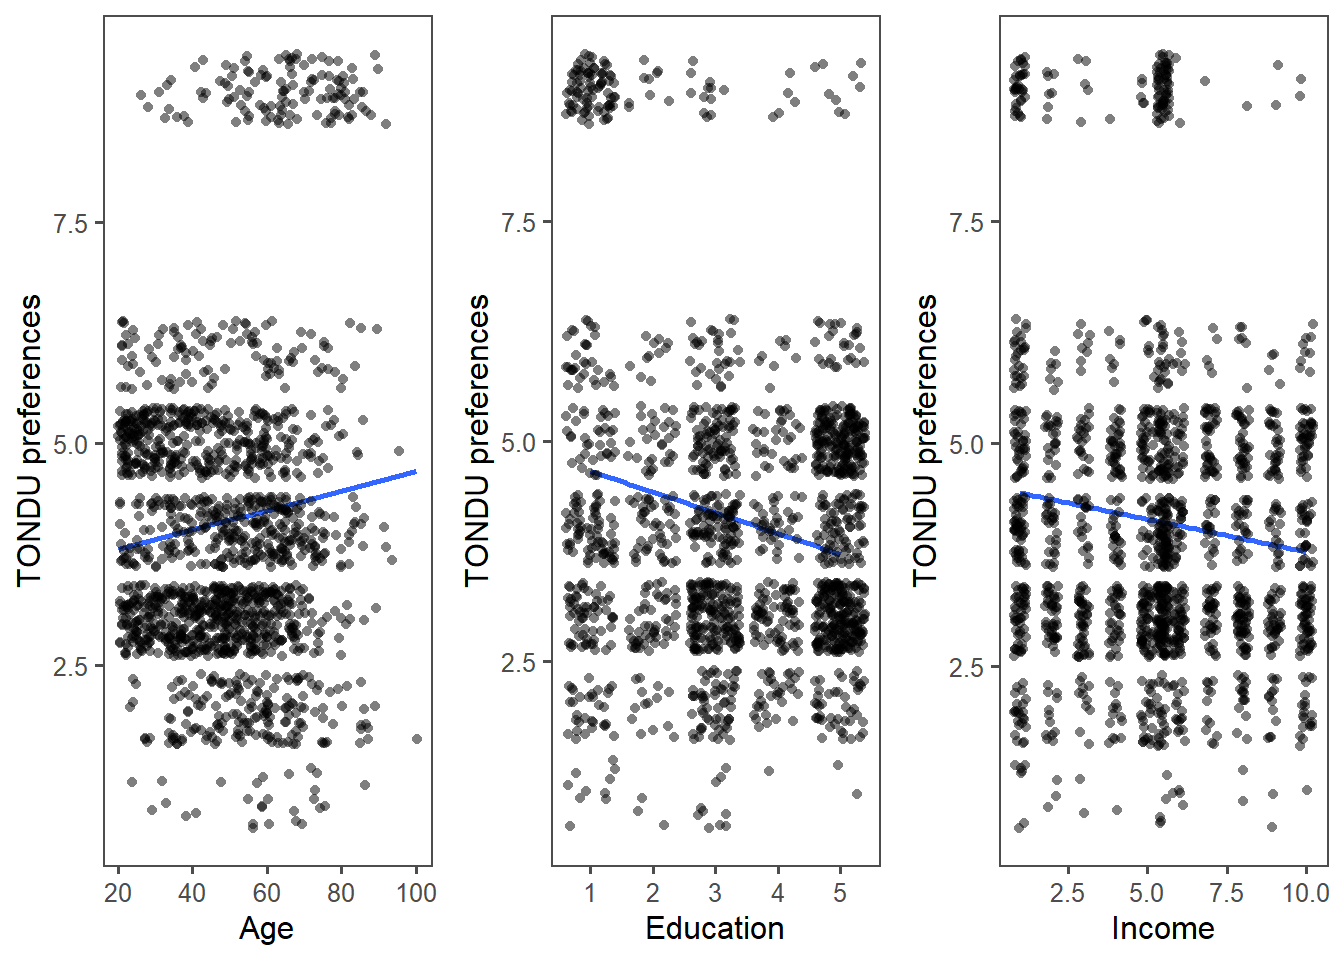
<- ggplot (sel_dat, aes (x= age,y= Tondu))+ geom_smooth (method = "lm" , se = F, show.legend = F)+ geom_point (show.legend = F, position = "jitter" ,alpha= .5 , pch= 16 ) + ggthemes:: theme_few () + labs (x= "Age" , y= "TONDU preferences" )<- ggplot (sel_dat, aes (x= edu,y= Tondu))+ geom_smooth (method = "lm" , se = F, show.legend = F)+ geom_point (show.legend = F, position = "jitter" ,alpha= .5 , pch= 16 ) + ggthemes:: theme_few () + labs (x= "Education" , y= "TONDU preferences" )<- ggplot (sel_dat, aes (x= income,y= Tondu))+ geom_smooth (method = "lm" , se = F, show.legend = F)+ geom_point (show.legend = F, position = "jitter" ,alpha= .5 , pch= 16 ) + ggthemes:: theme_few () + labs (x= "Income" , y= "TONDU preferences" )grid.arrange (ta,te,ti,ncol= 3 ,nrow= 1 )