[1] "country" "year" "migr" "fa" "inf" Assignment 4
Introduction
Foreign aid and migration are two closely intertwined topics that have gained significant attention in recent years. Foreign aid refers to the financial or material assistance provided by one country to another, typically with the aim of promoting economic, social, or political development in the recipient country. Migration, on the other hand, refers to the movement of people from one country to another, usually in search of better economic opportunities, political stability, or refuge from conflict or persecution.
Foreign aid can have both positive and negative effects on migration. On the one hand, aid can help to reduce poverty and create economic opportunities in recipient countries, which may discourage people from emigrating in search of better prospects. On the other hand, aid can also contribute to the creation of a dependent relationship between donor and recipient countries, which may perpetuate economic and political instability and ultimately drive people to migrate.
Moreover, the impact of migration on recipient countries can also vary depending on the context. While migration can bring new skills, ideas, and resources to host countries, it can also pose challenges in terms of social integration, labor market competition, and cultural differences.
Overall, the relationship between foreign aid and migration is complex and multifaceted, and requires careful consideration and analysis to understand its implications and potential solutions.
Data
The World Development Indicators (WDI) package in R is a tool used to access and manipulate data from the World Bank’s World Development Indicators database. The package provides functions for downloading and extracting data on a wide range of indicators related to economic and social development, such as population, GDP, education, health, and poverty.
The WDI package in R allows users to easily retrieve data from the World Bank database in a format that is suitable for analysis and visualization. The package includes functions for filtering and aggregating data, as well as for merging data from multiple indicators and countries.
Scaling all of the data
Scaling data before applying the k-means clustering algorithm is important because it helps to ensure that variables with larger scales or variances do not dominate the analysis.
K-means clustering is a distance-based clustering algorithm, which means that it uses the Euclidean distance between variables to form clusters. If variables have different scales, those with larger scales or variances will have a greater impact on the distance calculation, and thus, the clustering outcome.
By scaling the data, we can ensure that each variable has a similar range of values and variance, which allows the k-means algorithm to equally weigh each variable in the clustering process. This can improve the accuracy and robustness of the clustering results.
Additionally, scaling the data can also help to improve the interpretability of the results. Since the variables are on the same scale, it is easier to compare the contributions of each variable to the cluster formation and to understand the relative importance of each variable in differentiating between the clusters.
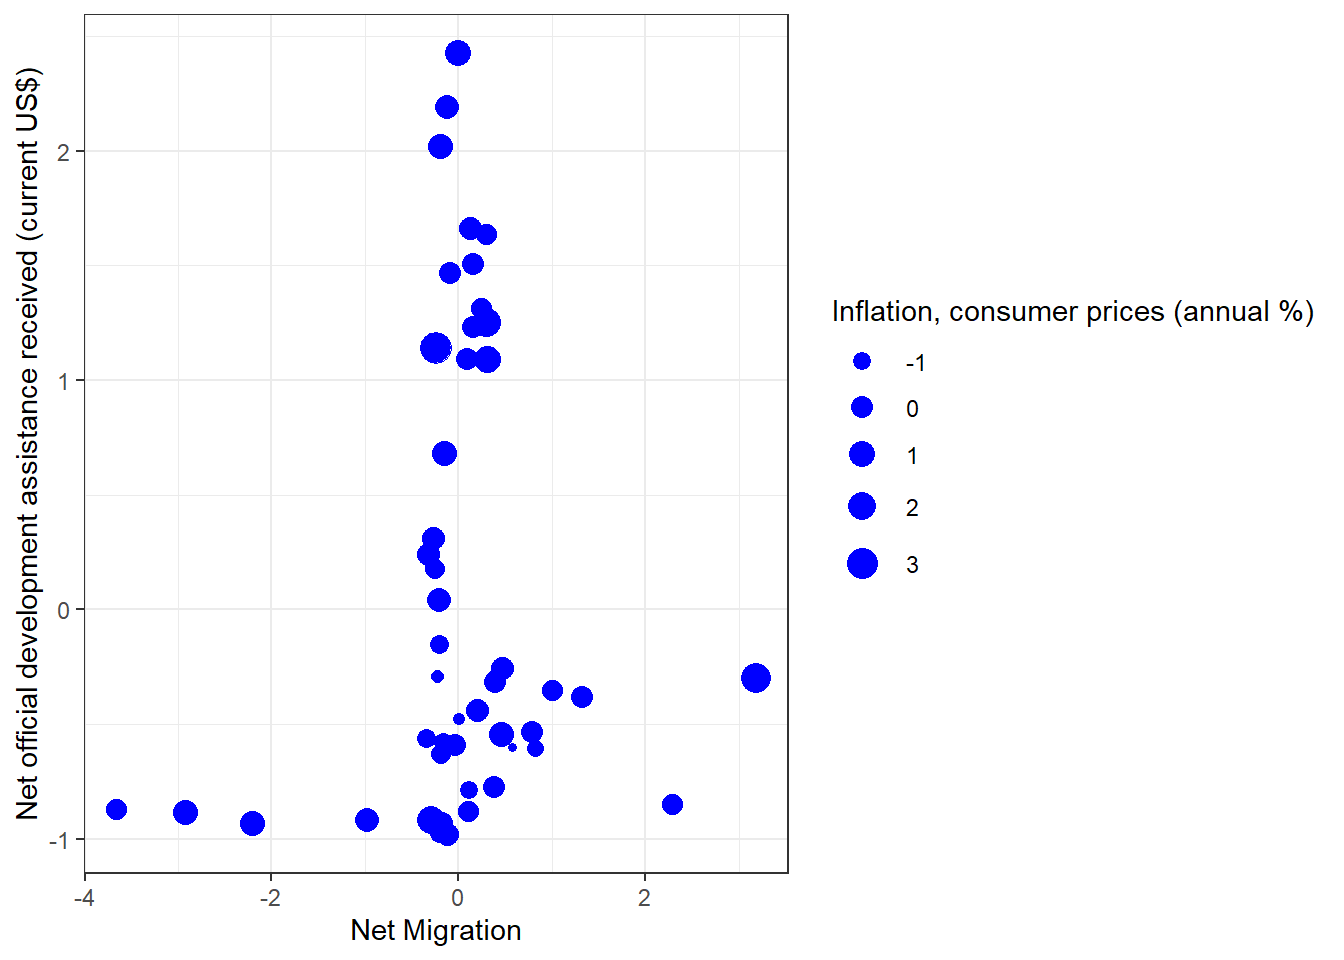
Animated clusterplot
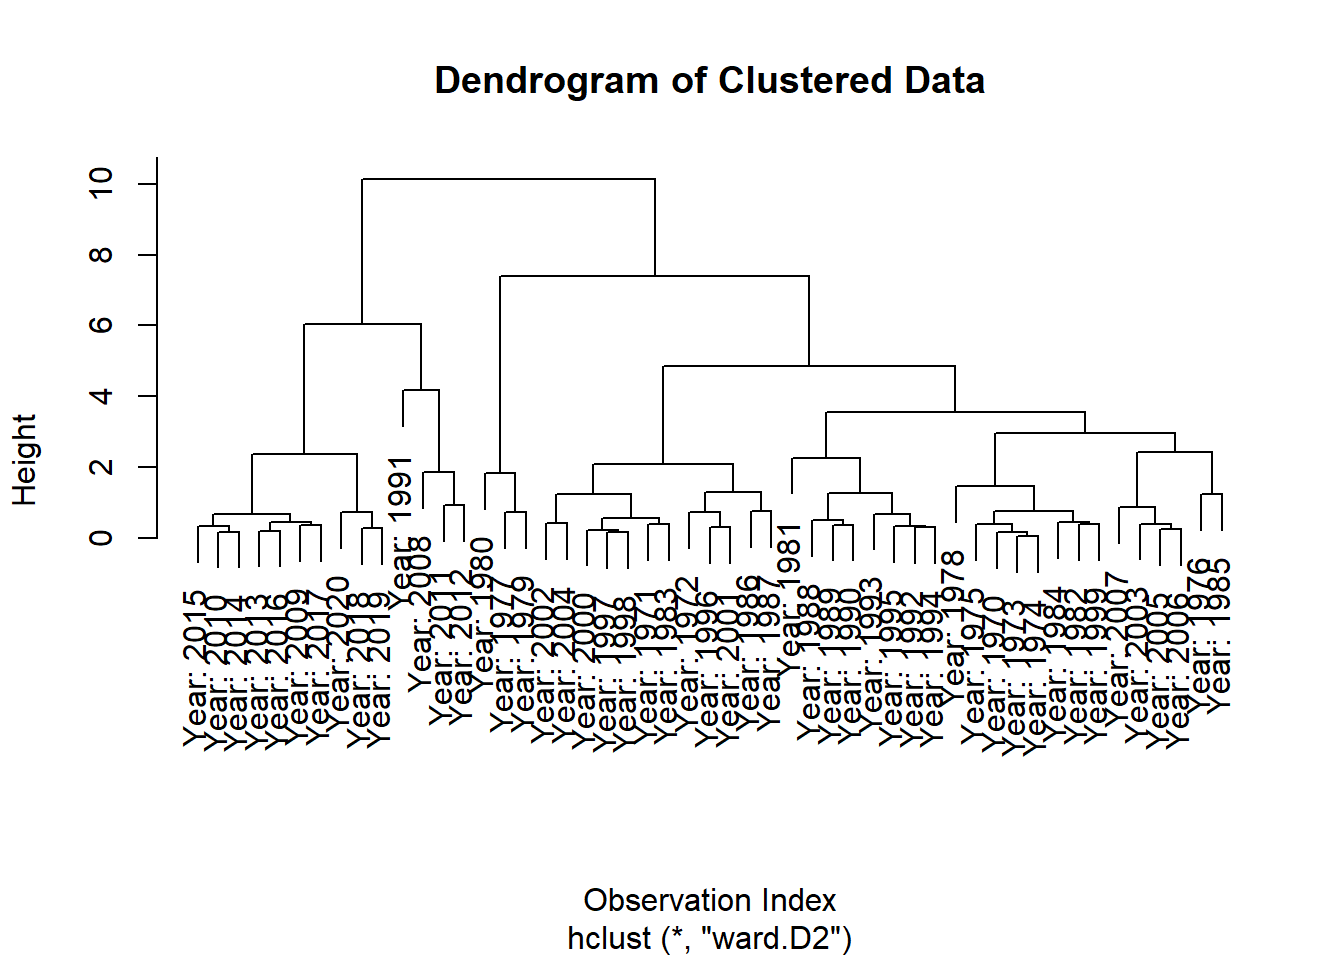
Hierarchical Clustering
Clustering plots & figuring out optimum cluster number
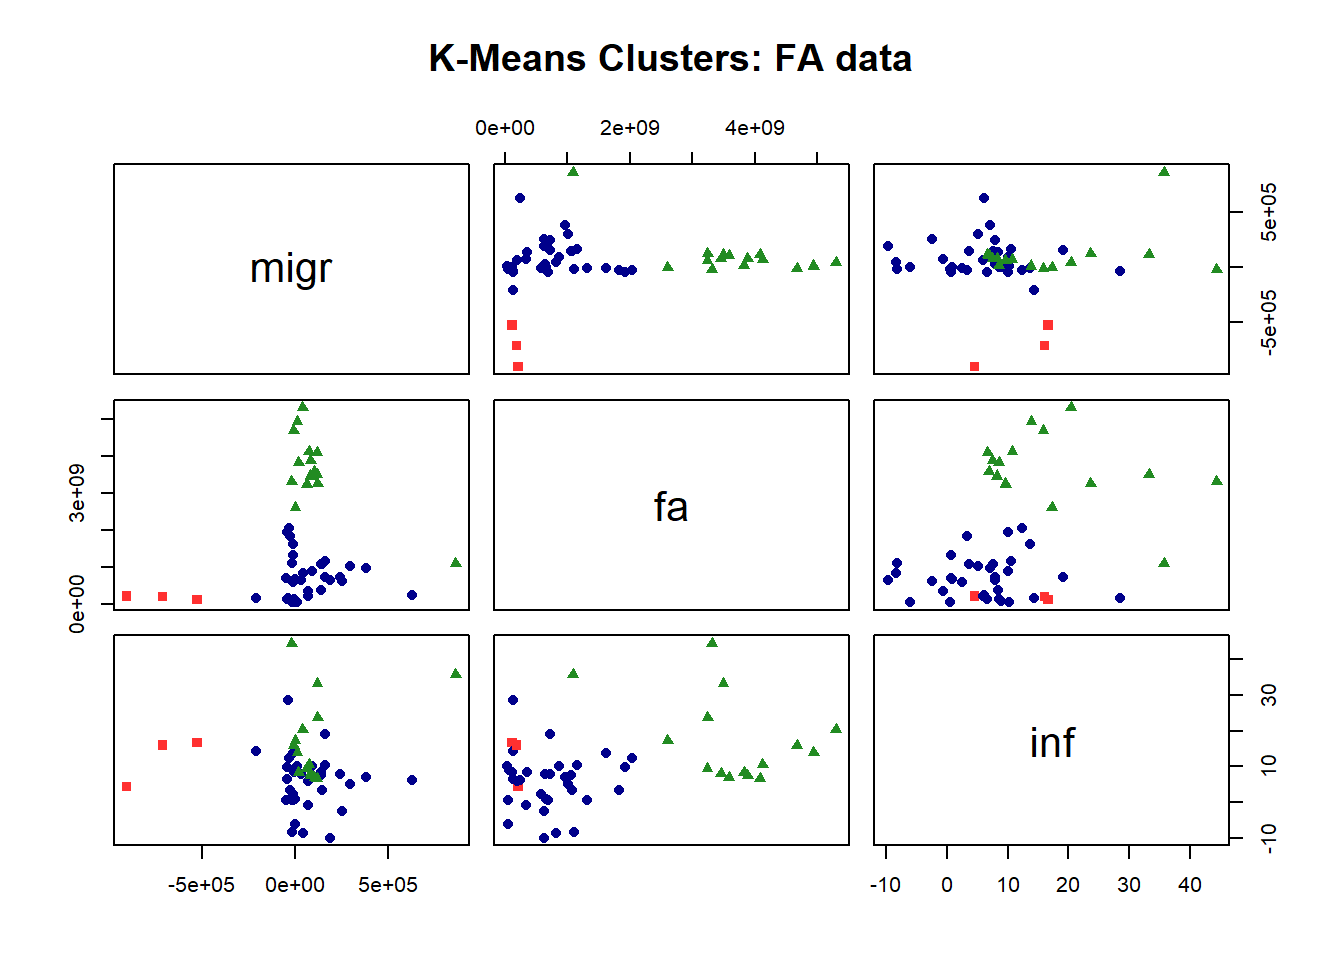
K-means clustering with 3 clusters of sizes 3, 33, 15

Cluster means:
   mig_scale   fa_scale  inf_scale
1 -2.9308285 -0.8960418  0.2749959
2  0.1423792 -0.5373472 -0.3690791
3  0.2729314  1.3613721  0.7569748

Clustering vector:
 [1] 2 2 2 2 2 2 2 1 2 1 1 2 2 2 2 2 2 2 2 2 2 3 2 2 2 2 2 2 2 2 2 2 2 2 2 2 2 3
[39] 3 3 3 3 3 3 3 3 3 3 3 3 3

Within cluster sum of squares by cluster:
[1]  1.920832 34.173419 33.295700
 (between_SS / total_SS =  53.7 %)

Available components:

[1] "cluster"      "centers"      "totss"        "withinss"     "tot.withinss"
[6] "betweenss" "size" "iter" "ifault" 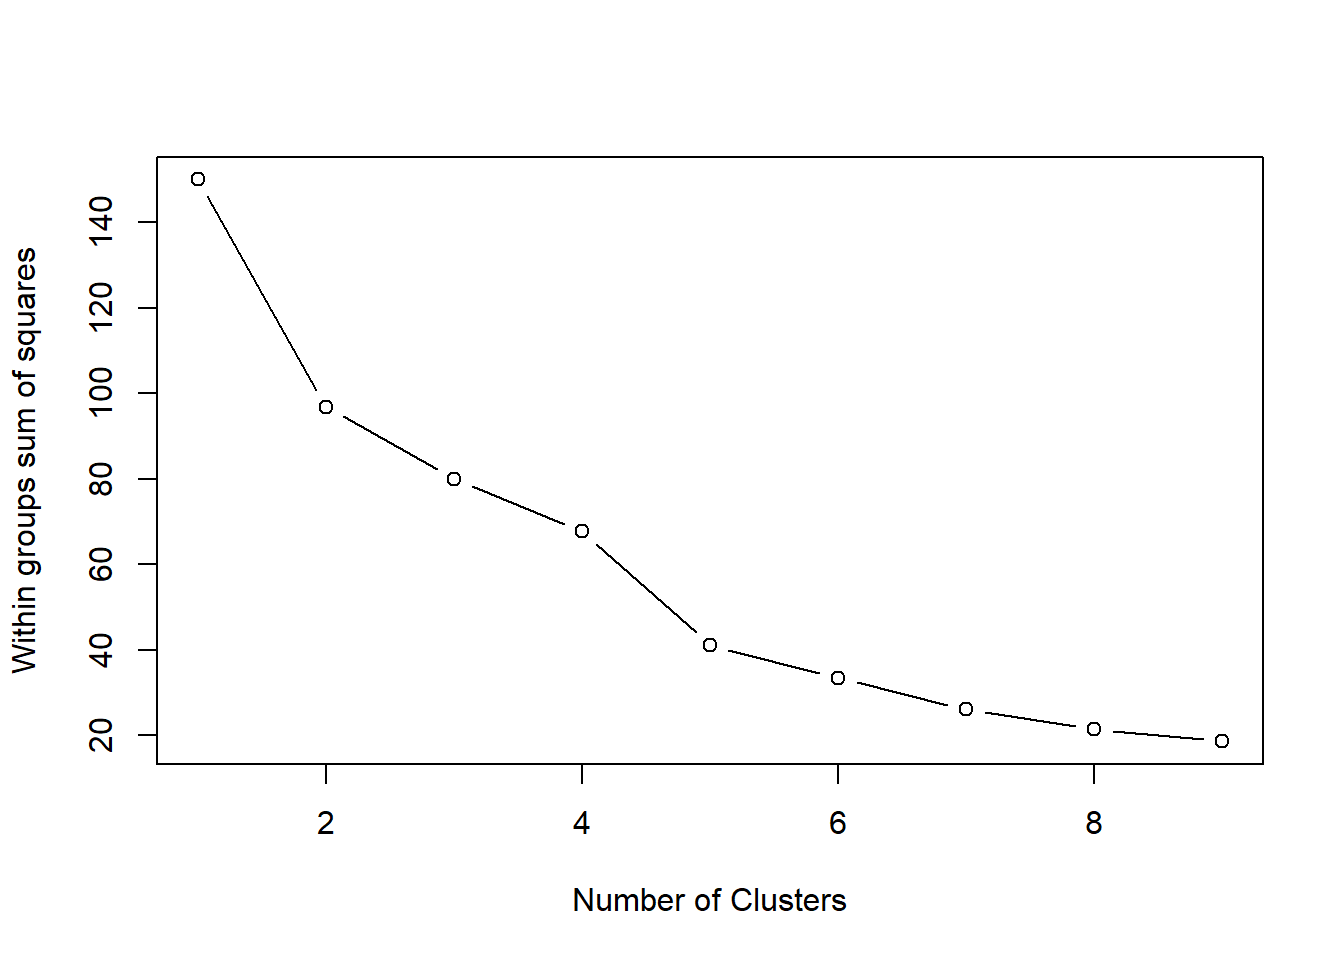
Further plots
 1  2  3
3 33 15 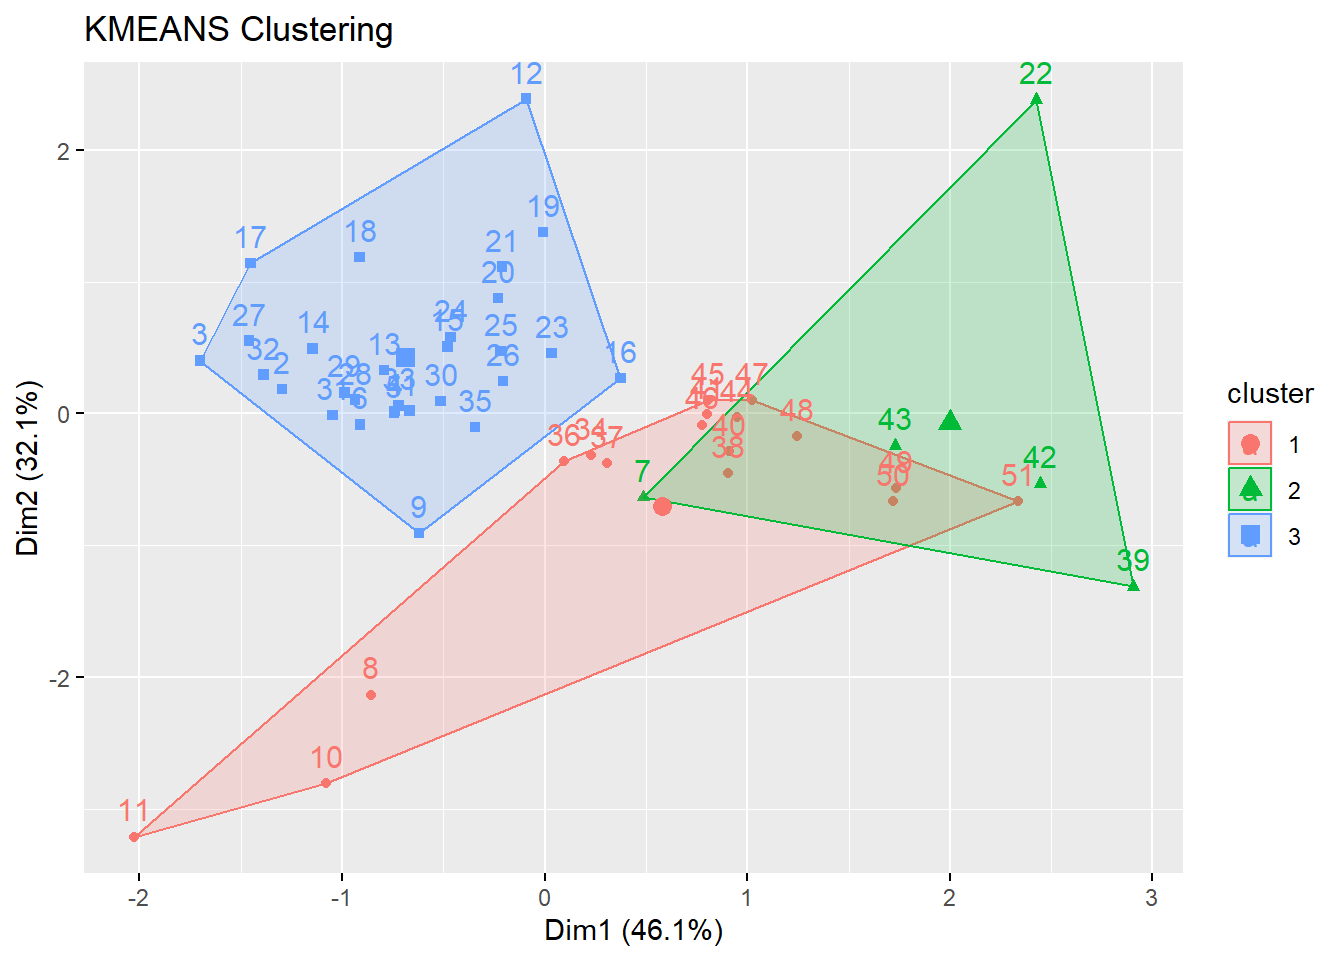
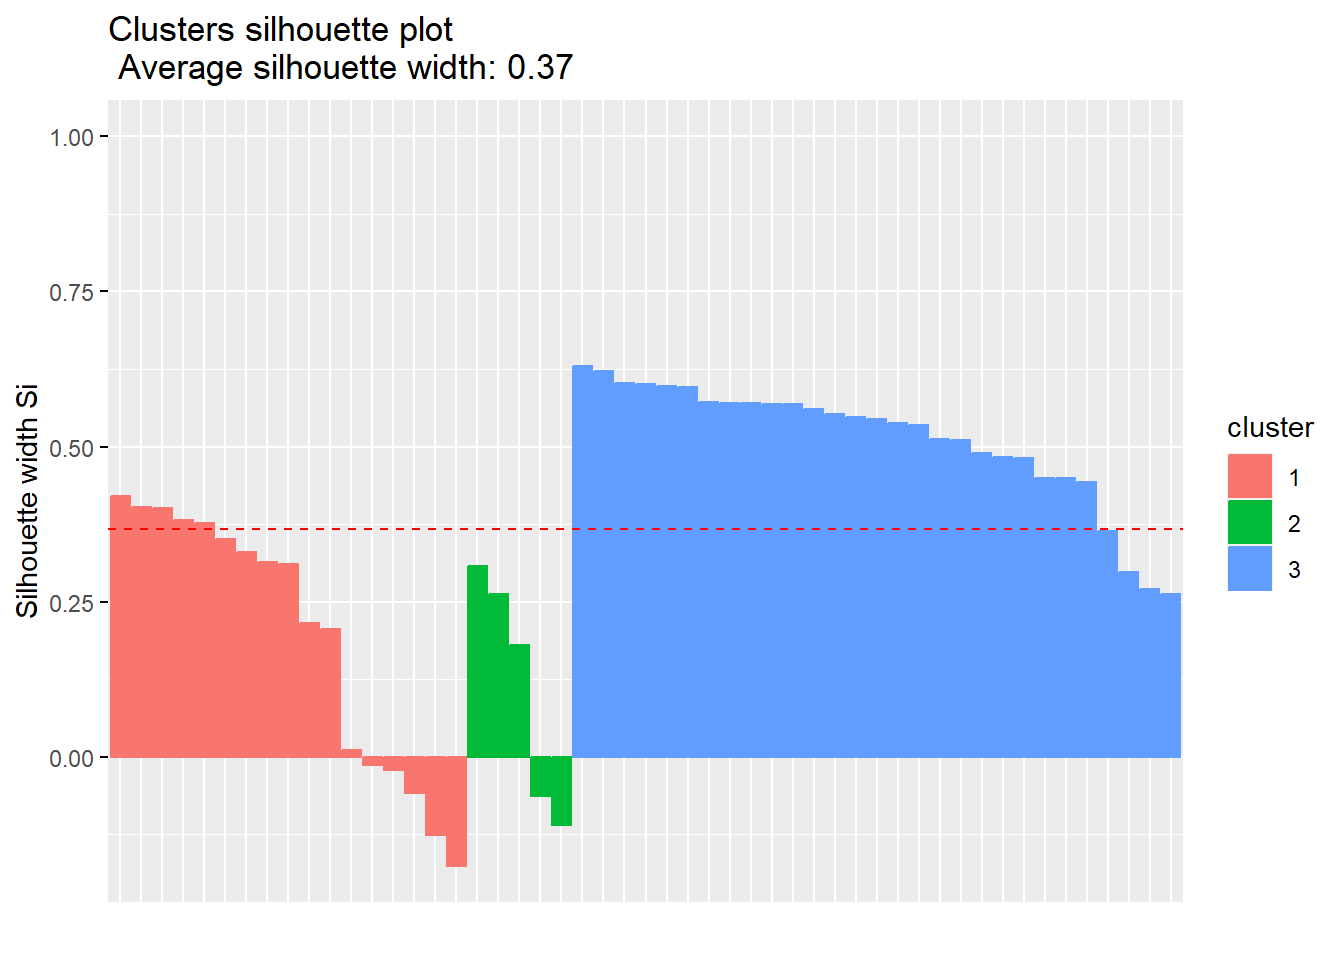
  cluster size ave.sil.width
1       1   17          0.20
2       2    5          0.12
3       3   29          0.51